Drawing an MRSI voxel on an anatomical slice
I have one MRSI voxel’s index
[i, j, k]. Which pixel does it land on in a T1 slice, and how big a box do I draw around it?
Both questions come down to one thing: a NIfTI affine maps a voxel index to the world-space center of that voxel, in millimeters — never a corner. Every function on this page exists to get that one mapping right, because the two ways to get it subtly wrong (an off-by-half-voxel offset, a double-applied shift) don’t crash — they draw a box next to the right answer, which is much harder to notice.
| Function | What it does here |
|---|---|
get_voxel_visible_slice_range() | which T1 slices a given MRSI voxel is visible on |
draw_voxel_overlays_on_ax | draws the voxel box, given an MRSI→display affine |
import matplotlib.pyplot as plt
import numpy as np
import pytest
from nibabel import affines

from mnutils.plotting.images import draw_voxel_overlays_on_ax, get_voxel_visible_slice_range
Mapping an MRSI voxel index to a T1 voxel index
mrsi2anat = inv(T1.affine) @ MRSI.affine composes the two affines into one: MRSI voxel index in,
T1 voxel index out. Applying it to voxel [0, 0, 0] should land exactly on the world-space center
of that voxel, converted into T1’s index space — the same answer you’d get by hand from each
affine separately.
t1_affine = np.diag([0.5, 0.5, 3.0, 1.0])
t1_affine[:3, 3] = [-100.0, -80.0, -90.0]

mrsi_affine = np.diag([12.5, 12.5, 12.5, 1.0])
mrsi_affine[:3, 3] = [-50.0, -40.0, -30.0]  # voxel 0 center, in world mm

mrsi2anat = np.linalg.inv(t1_affine).dot(mrsi_affine)

voxel = (3, 5, 2)
result = affines.apply_affine(mrsi2anat, voxel)
print(result)
[175. 205. 28.33333333]
Drawing the box: corner = center minus half-width
matplotlib.patches.Rectangle takes a corner, not a center — so the box’s corner has to be the
voxel’s world center, offset back by half the voxel’s own display width. Get that offset wrong by
even a little and the box still looks plausible; it’s just centered on the wrong point.
mrsi2anat_2d = np.diag([25.0, 25.0, 4.17, 1.0])
mrsi2anat_2d[:3, 3] = [68.39, 71.91, 9.83]

voxel_in_anat = affines.apply_affine(mrsi2anat_2d, (3, 4, 5))
correct_offset = mrsi2anat_2d[0, 0] / 2
correct_corner = voxel_in_anat[1] - correct_offset
print(correct_corner, "-> center", correct_corner + correct_offset, "vs", voxel_in_anat[1])
159.41 -> center 171.91 vs 171.91
❌ The bug this guards against: a hardcoded offset (affine[0, 0] - 13, tuned to look right
for one dataset’s voxel size) instead of affine[0, 0] / 2. The two agree only by coincidence
for the voxel size they were tuned against — 12 vs. the correct 12.5 above, half a T1 voxel off
for every other dataset.
✅ The rule: the offset is always voxel_size / 2, derived from the affine itself, never a
constant.
draw_voxel_overlays_on_ax gets this right even when the display affine transposes the axes (a
common case: MRSI axis 0 maps to the display column, not the row) — the voxel extents then live
off-diagonal, so reading affine[0, 0]/affine[1, 1] directly for the box size would silently
give zero:
vs = 25.0
mrsi_to_display = np.array(
    [
        [0.0, -vs, 0.0, 440.0],
        [-vs, 0.0, 0.0, 444.0],
        [0.0, 0.0, 4.17, 9.83],
        [0.0, 0.0, 0.0, 1.0],
    ]
)
assert mrsi_to_display[0, 0] == 0 and mrsi_to_display[1, 1] == 0  # off-diagonal, on purpose

fig, ax = plt.subplots()
polys = draw_voxel_overlays_on_ax(ax, [(3, 4, 5)], mrsi_to_display)
plt.show()

xy = polys[0].get_xy()[:4]
width = xy[:, 0].max() - xy[:, 0].min()
height = xy[:, 1].max() - xy[:, 1].min()
print(width, height)
25.0 25.0
Which T1 slices a voxel is visible on
An MRSI voxel is thick — it spans several thin T1 slices along the through-plane axis.
get_voxel_visible_slice_range returns the (min, max) T1 slice indices the voxel covers,
always including the slice nearest its own center, and clamped to [0, n_slices - 1] so a voxel
near the edge of the volume never returns an out-of-bounds index.
mrsi2anat_z = np.diag([25.0, 25.0, 4.17, 1.0])

center_slice = get_voxel_visible_slice_range((5, 5, 5), mrsi2anat_z)
print("voxel [5,5,5] visible on T1 slices", center_slice)

edge_clamped = get_voxel_visible_slice_range((0, 0, 0), mrsi2anat_z, n_slices=76)
print("voxel [0,0,0] visible on T1 slices", edge_clamped, "(clamped to 76 slices)")
voxel [5,5,5] visible on T1 slices (19, 22)
voxel [0,0,0] visible on T1 slices (0, 2) (clamped to 76 slices)
create_MRSI_affine: why the shift is half a voxel-size change
MRSISeries.create_MRSI_affine() builds the “blocky” grid
affine (one cell per acquired voxel) from the fine, interpolated nii.affine it started from.
Both affines use the standard NIfTI convention — index i’s center sits at
world = voxel_size * i + translation — and both describe the same field of view, just at
different resolutions. Scaling the voxel size alone keeps voxel 0’s world position pinned to the
fine grid’s corner instead of its own center, so the origin needs a shift too: exactly half of how
much the voxel size changed, (new_voxel - old_voxel) / 2.
from mnutils.GESeries import MRISeries, MRSISeries
from mnutils.testing import build_fake_exam

t1_nist = MRISeries(build_fake_exam("nist_phantom_exam") / "data", 2)
mrsi = MRSISeries(build_fake_exam("nist_phantom_exam") / "data", 5)mrsi.RAW_exp.overlay_on_T1(t1_nist)t1_nist.display()fine_affine = mrsi.nii.affine
blocky_affine = mrsi.create_MRSI_affine()
resize_shift = (np.diag(blocky_affine[:3]) - np.diag(fine_affine[:3])) / 2
print(np.allclose(blocky_affine[:3, 3], fine_affine[:3, 3] + resize_shift, atol=1e-3))True
MRSISeries.RAW_exp (the blocky NIfTI used for overlay display) is built from exactly this
affine — the assertion above is what keeps them from drifting apart.
Cropping the display without breaking the voxel box
draw_voxel_overlays_on_ax always computes the box in full, uncropped display coordinates —
it only depends on mrsi_to_display_affine, never on the image array you actually plotted. Crop
the anatomical/MRSI images to a tighter figure and the box drawn by the un-cropped affine now
points at the wrong pixel unless you shift it back by the crop’s own offset.
from mnutils.GESeries import MRISeries, MRSISeries
from mnutils.plotting.images import draw_voxel_overlays_on_ax, overlay_image_data_on_T1
from mnutils.utils.nifti import get_display_affine, resample_and_orient_nifti

hevo18_data = build_fake_exam("brain_mrs_mrsi_exam") / "data"
t1 = MRISeries(hevo18_data, 2)
mrsi_brain = MRSISeries(hevo18_data, 8)

t1_full, mrsi_full = resample_and_orient_nifti(source_nii=mrsi_brain.RAW_exp.nii, target_nii=t1.nii)
mrsi_to_display = np.linalg.inv(get_display_affine(t1.nii)).dot(
    np.asarray(mrsi_brain.RAW_exp.nii.affine)
)

demo_voxel = (5, 5, 8)
y_slice, x_slice = slice(140, 200), slice(90, 150)
x_offset, y_offset = x_slice.start, y_slice.start

fig, ax = plt.subplots(figsize=(4, 4))
overlay_out = overlay_image_data_on_T1(
    t1_full[y_slice, x_slice, demo_voxel[2]],
    mrsi_full[y_slice, x_slice, demo_voxel[2]],
    ax=ax,
)
(patch,) = draw_voxel_overlays_on_ax(ax, demo_voxel, mrsi_to_display_affine=mrsi_to_display)
# Shift the box from full-image coordinates into the cropped axes' coordinates.
patch.set_xy(patch.get_xy() - np.array([x_offset, y_offset]))
plt.show()

xy = patch.get_xy()[:4]
print(xy.min(axis=0) >= 0, xy.max(axis=0) <= [x_slice.stop - x_offset, y_slice.stop - y_offset])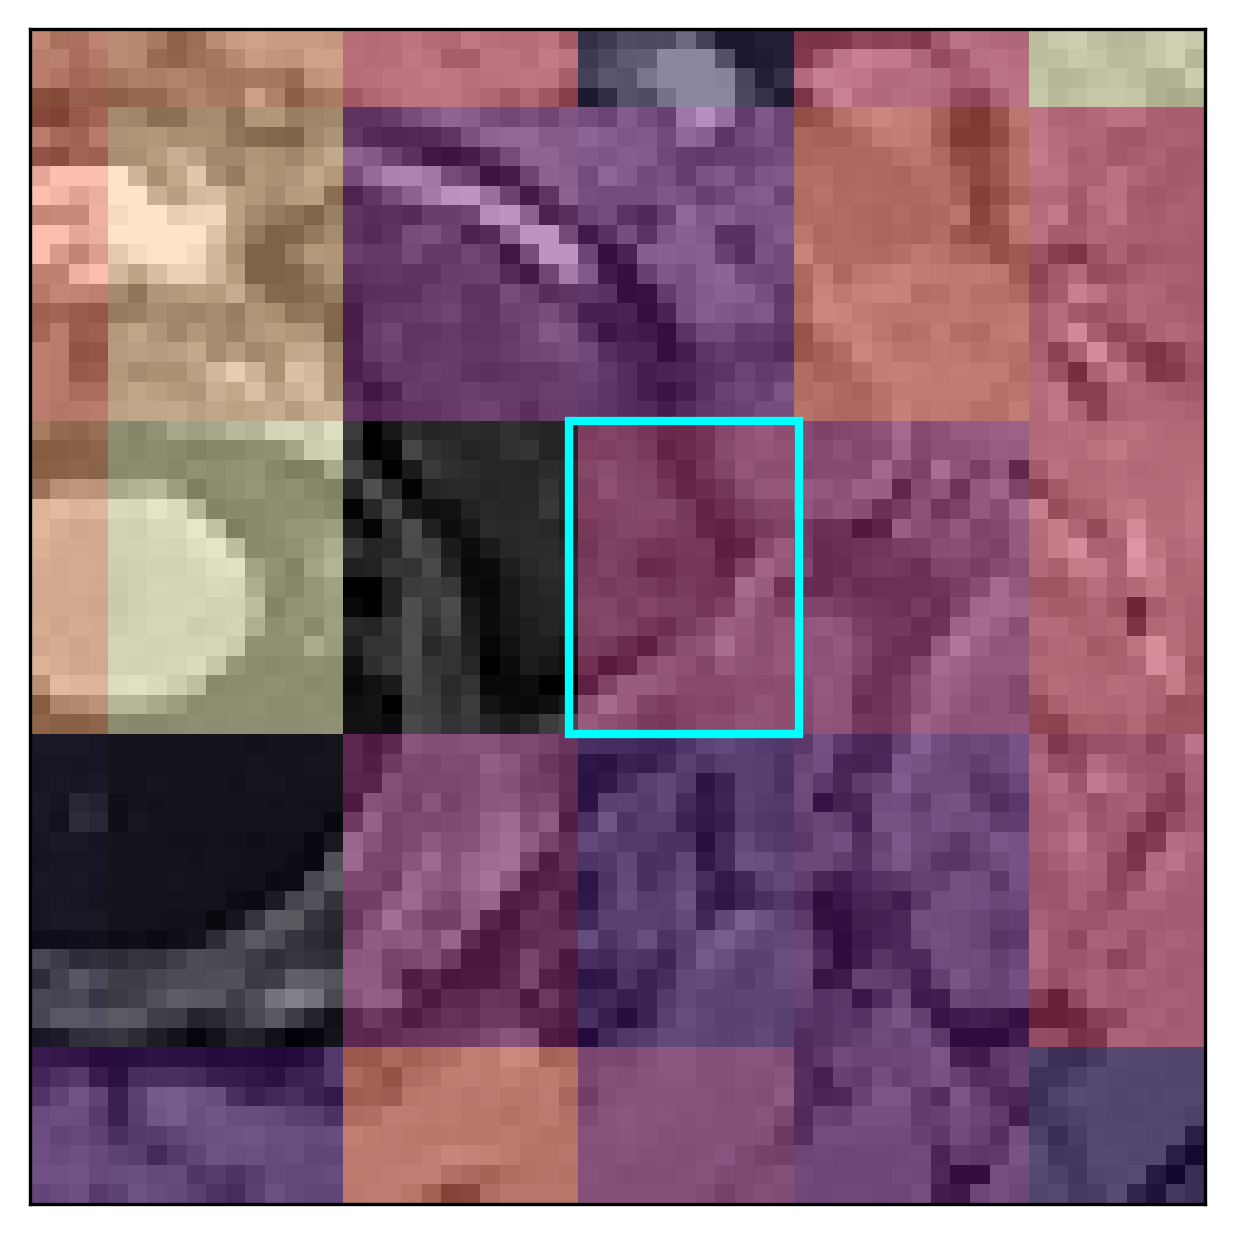
[ True True] [ True True]
The recipe, generalized:
Build
mrsi_to_display_affine = inv(get_display_affine(T1)) @ MRSI.RAW_exp.nii.affine.Crop both anatomical and (resampled) MRSI images with the same
(y_slice, x_slice, z)bounds.Plot the cropped images with
overlay_image_data_on_T1(..., ax=...).Draw the voxel box with
draw_voxel_overlays_on_ax(ax, voxel, mrsi_to_display_affine, ...)— still in full-image coordinates.Shift the patch:
patch.set_xy(patch.get_xy() - np.array([x_offset, y_offset])).
For a single voxel with no cropping, overlay_voxel_on_T1() wraps
steps 1, 3 and 4 into one call:
from mnutils.plotting.images import overlay_voxel_on_T1

fig, ax = overlay_voxel_on_T1(t1, mrsi_brain, demo_voxel, figsize=(4, 4))
plt.show()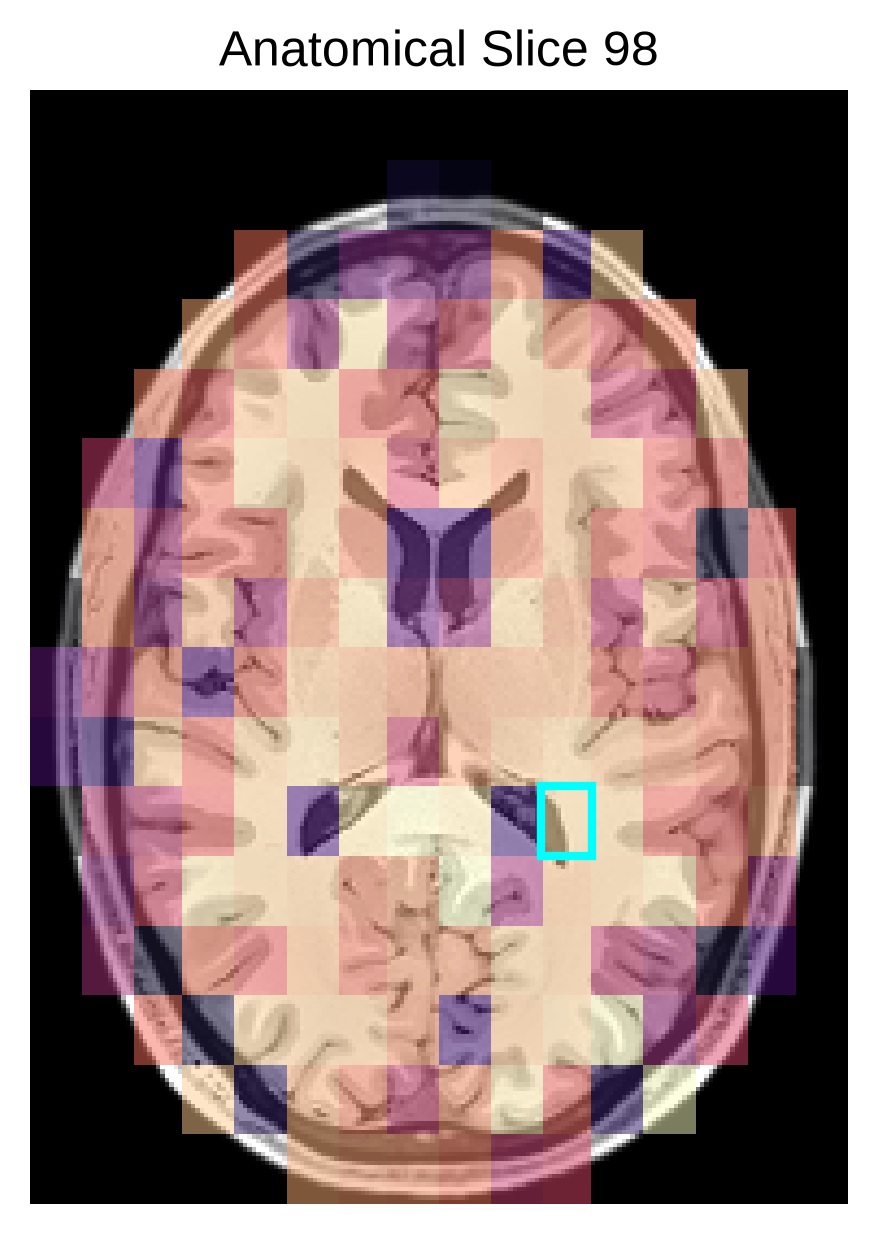
ax= is one of three ways to call overlay_image_data_on_T1
The single-Axes draw above is what overlay_image_data_on_T1(..., ax=...) dispatches to
whenever ax is given -- there is no client-side Axes for a fast raster widget to draw into, so
ax always forces matplotlib. Leave ax out and the T1/data/overlay slice-scrubbing widget is
the default, rendered without a Figure at all:
raster_result = overlay_image_data_on_T1(t1_full, mrsi_full)
print(raster_result)None
engine="matplotlib" opts back into the pre-raster path, including its (Figure, axes) return
for single-slice input:
mpl_fig, mpl_axes = overlay_image_data_on_T1(
    t1_full[:, :, demo_voxel[2]], mrsi_full[:, :, demo_voxel[2]], engine="matplotlib"
)
plt.show()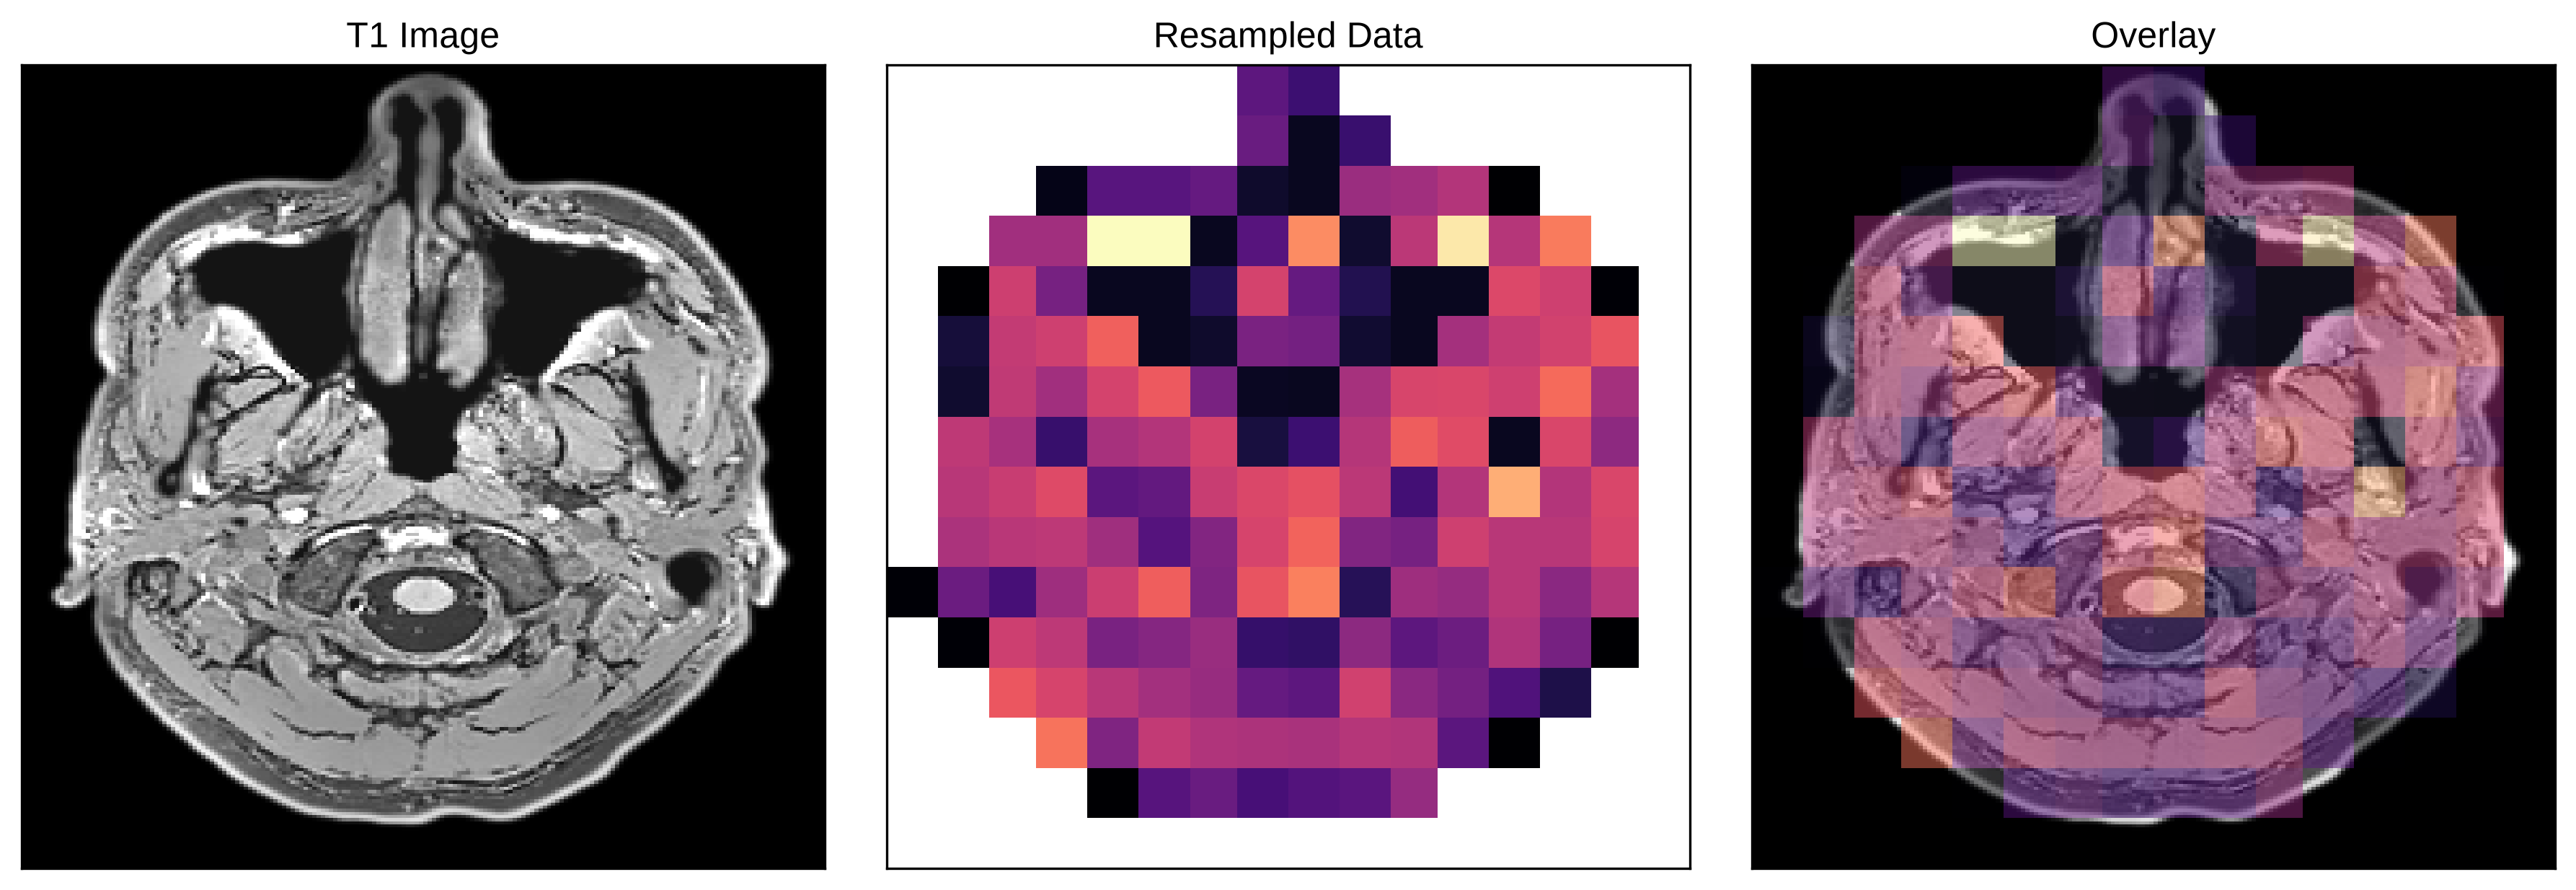
The raster engine has no contour tracing, so mask_contour warns and is dropped rather than
silently doing nothing or erroring:
demo_mask = np.zeros(t1_full.shape, dtype=bool)
demo_mask[t1_full.shape[0] // 4 : 3 * t1_full.shape[0] // 4, :, :] = True
mask_contour_result = overlay_image_data_on_T1(
    t1_full, mrsi_full, mask=demo_mask, mask_contour=True
)